

Spending on “social protection”
Spending on ‘social protection’ remained the most important COFOG sector in 2022 in the EU and in all reporting EU and EFTA countries. This reflects the core function of government, which is to redistribute income and wealth through compulsory payments. Unsurprisingly, the expenditure category that dominates this sector is ‘social benefits and social transfers in kind (purchase market production)’. Social benefits are paid to households to reduce social risks and needs. Examples include unemployment benefits and pension payments. In the EU in 2022, social benefits and in-kind social transfers (purchases of market production) accounted for approximately 88% of expenditures in the social security COFOG sector.

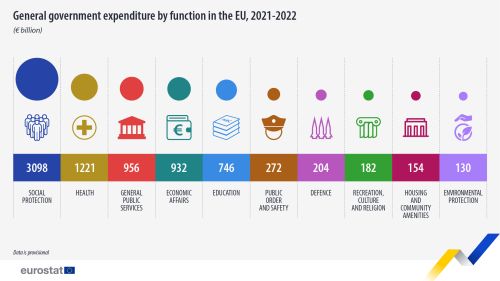
Spending on social protection in the EU in 2022 was EUR 3,098 billion, equivalent to 19.5% of GDP and 39.2% of total expenditure.
The most important group in this sector so far, the “older population” (10.4% of GDP), is mainly concerned with pension payments.
The second largest group, expenditure on “sickness and disability” (2.8% of GDP), represents social payments in cash or in kind, mainly related to social insurance schemes.
In the EU in 2022, the groups “Families and Children” (1.9% of GDP), “Survivors” (1.5% of GDP) and “Unemployment” (1.2% of GDP) also accounted for an important part of expenditure. The “Survivor” group primarily includes pension payments to the surviving family of a deceased insured.
“Housing” mainly consisted of housing costs and social security payments to households to support the operation of the public housing system, and accounted for 0.3% of GDP.
Expenditures related to “social exclusion not elsewhere classified” accounted for 1.1% of GDP at EU level in 2022. This includes benefits for socially excluded people, such as low-income earners, refugees, and people suffering from substance abuse. This group also includes households seeking to reduce the impact of rising energy prices. This, along with the increase in refugees due to Russia’s war of aggression in Ukraine, will cause spending to increase in 2022.
Government spending on social protection as a percentage of GDP varies by EU member state from 7.5% to 23.8%.
Social security accounted for the largest area of general government expenditure in 2022 in all EU member states. Government spending on social security as a percentage of GDP varies across EU member states, ranging from 7.5% of GDP in Ireland to 23.8% in France.
In 2022, six EU member states – France (23.8% of GDP), Finland (23.6% of GDP), Italy (21.9% of GDP), Austria (20.6% of GDP), Germany (20.4% of GDP) ), Belgium (20.3% of GDP) – devote at least 20% of GDP to social protection. At the other end of the spectrum are Ireland (7.5% of GDP), Malta (10.1% of GDP), Cyprus (11.8% of GDP), Estonia (12.7% of GDP) and Croatia (12.9% of GDP). Among EFTA countries, Iceland (11.1% of GDP) and Switzerland (12.9% of GDP) each spend less than 13% of their GDP on social security.
“Social security” expenditures by type of transaction
At EU level in 2022, 88% of spending on “social protection” was in the form of social (cash) transfers and in-kind social transfers (purchases of market production). This category includes payments of retirement or survivor pensions, unemployment benefits, benefits related to absence from work due to illness, accident or maternity, family benefits, educational benefits or other benefits to dependents. 5% of expenditure in this sector is in the form of employee remuneration, for example wages and salaries of staff managing social protection systems, 3% in the form of intermediate consumption (purchases of goods and services) and 3% in other It was related to ordinary affairs. For example, money is sent to non-profit agencies that serve households or for non-means-tested assistance to households.
Trends in “spending on social protection”
Compared to 1995, expenditure on ‘social protection’ has increased as a proportion of total expenditure at EU level, from 36.6% of total expenditure in 1995 to 39.2% of total expenditure in 2022. Compared to the period 2016-2020, the EU has a significantly higher share of social protection in 2021 (39.7 %) and 2022 (over 41 % on average) and a lower share of social protection in total expenditures. was at a relatively low level.
Spending on “social protection” as a percentage of GDP will remain high in 2022 (19.5% of GDP), still affected by government spending measures to mitigate the impact of the pandemic, but compared to 2020 (21.9%). %) to a lesser extent. However, government measures to mitigate the impact of rising energy prices had a significant impact on the level of spending on ‘social protection’ in 2022. The decrease in this ratio compared to the previous year is mainly due to the following reasons: The increase in nominal GDP outweighed the impact of the increase in total spending in the sector in nominal terms, from EUR 2,985 billion in 2021 to EUR 3,098 billion in 2022.
Over the period 1995-2022, spending on “social protection” increased as a percentage of GDP from 19.4 percent of GDP in 1995 to 19.5 percent of GDP in 2022. The largest annual increase in this ratio was in 2020 (2.6 percent). Point), 2009 (1.9 pp). This was the result of a decline in GDP in both periods and an increase in aggregate spending on “social protection” to cushion the effects of the financial crisis and the COVID-19 pandemic, respectively.
Spending on “unemployment” in the EU increased noticeably from 1.4% of GDP in 2008 to 1.9% in 2009, then gradually decreased until 2019 (1.3% of GDP), but in 2020 the EU Spending on “unemployment” has increased sharply (2.2% of GDP) due to government measures to alleviate the economic and social impact of the COVID-19 pandemic. This ratio remained at a high level (1.7% of GDP) in 2021 due to the impact of government measures, but fell to 1.2% of GDP in 2022, below the pre-pandemic level. From 2019 to 2022, spending on unemployment at EU level will increase from €180 billion in 2019 to €297 billion in 2020, decrease to €247 billion in 2021 and €188 billion in 2022. did. This evolution is particularly due to increased support between EU countries. The furlough scheme was designed to prevent the coronavirus pandemic, particularly widespread unemployment.
From 2021 to 2022, among the more detailed social protection functions, a significant decrease in “unemployment” and “old age” as a percentage of GDP at EU level will be due to an increase in spending on “social exclusion”. This was only partially compensated for by small increases.
Not all features of government spending have evolved in the same way over the period analyzed. Some features have a natural tendency to become countercyclical even without policy changes. For example, government spending on unemployment benefits (part of social security) is more likely to develop in a naturally countercyclical manner than other functions, such as government spending on education. While more people become unemployed during economic crises, student numbers are significantly affected by long-term demographic changes.
Source data for tables and graphs
Detailed table ![]() Available here.
Available here.
Data sources and availability
Data reporting to Eurostat
Annual Government Finance Statistics (GFS) data are collected by Eurostat under the European Accounting System (ESA 2010) submission program. Member States are required to submit, among other tables, Table 1100 “General Government Expenditures by Function” 12 months after the end of the reference period. Table 1100 provides information about major COFOG functions and general government sector expenditures categorized by ESA 2010 categories. Communication of the COFOG I level breakdown (sectors) has been mandatory since 1995, but information about his COFOG II level (COFOG group) at general government level has not been provided compulsorily since base year 2001. Masu. The main reference year used in this publication is 2022, which is the latest year available at EU level.
Data was extracted on February 29, 2024.
Preliminary data
Although significant efforts have been made to harmonize the record of government measures to reduce the impact of energy price increases, full harmonization of data for the base year 2022 has not yet been achieved.
Data for EU and Eurozone Aggregate (2022), Belgium (2022), Germany (2020-2022), Spain (2022), France (2021-2022), and Portugal (2022) are provisional. It’s something.
Definition of general government and its subsectors
The data relate to the general government sector of the economy as defined in paragraph 2.111 of ESA 2010. “The general government sector (S.13) is made up of institutional units whose products are non-market producers for individual and collective consumption” and units belonging to other sectors or primarily national It is financed by compulsory payments made by institutional units engaged in the redistribution of income and wealth.
Classification of government functional expenditure
The Functional Classification of Government (COFOG) divides government spending into 10 major categories (known as “COFOG I-level” breakdowns). defence; public order and safety; Economic circumstances. protecting the environment; housing and community issues; Health; Recreation, Culture, Religion. education; social protection; These departments are further divided into “groups” (COFOG II level).
For “social protection” the groups are:
- “Illness and disability”
- ‘old age’,
- “Survivor”,
- “Family and Children”
- “unemployment”,
- ‘housing’,
- “Social exclusion bottleneck”
- “Social protection research and development”;
- “Social protection bottleneck”
For more information on the sources of COFOG statistics and how to compile them, please refer to the Eurostat manual.
satellite account
Administrative expenditure data is additionally collected in so-called satellite accounts. Generally, it is expected that the amount of expenditures recorded in the satellite accounts will exceed the amount of expenditures recorded in each of his COFOG departments. For more information on the comparability of COFOG data and satellite account data, please refer to the COFOG manual.
Definition of total general government expenditures
Total government expenditures are defined in paragraph 8.100 of ESA 2010, using the list of ESA 2010 categories as reference. For more information, see our overview article on Government Expenditures by Function – COFOG.
GDP
Nominal GDP, or GDP at current prices, is used throughout this publication.
Recording time and symbols used
In the ESA 2010 system, recording is done on an accrual basis, that is, “when economic value is created, transformed, or disappears, or when claims and obligations are transformed or canceled as they arise.”
“:” not available
“pp” percentage point
Further data and information
For country-specific considerations such as missing data, please refer to the metadata published by Eurobase. The author can be contacted at ESTAT-GFS@ec.europa.eu.
context
In the framework of the European System of National Accounts (ESA 2010), Eurostat collects data on general government expenditure by economic functions according to the International Classification of Functions of Government (COFOG) (see methodology note).